


As the Arms Trade Treaty’s first Conference of States Parties convenes in Cancún, Mexico from 24-27 August, Amnesty International is campaigning for transparency in all aspects of the arms trade, including comprehensive state reporting on the scale and range of their arms imports and exports.
Weapons and ammunition in circulation
Total current military stocks of China, USA, Russia, India, France and UK:
15,426 Battle tanks
17,816 Armoured combat vehicles
36,621 Large calibre artillery systems
7,644 Combat aircraft
1,485 Attack helicopters
269 Warships
527 Heavy unmanned aerial vehicles
[Source: The Military Balance]
875 million small arms and light weapons are estimated to be in circulation worldwide. [Source: Small Arms Survey]
Between 700,000 and 900,000 small arms are produced annually. [Source: Small Arms Survey]
Value of transfers
• A definitive figure for the value of international conventional arms transfers is difficult to calculate with precision. In 2010, the total value, as recorded in national statistics, was approximately US$72 billion. Since then, it is estimated that it the arms trade has been approaching US$100 billion annually. [Source: Solutions, “The Arms Trade Treaty: Building a Path to Disarmament”, 2013]
• The annual authorized trade in small arms and light weapons exceeds US$8.5 billion. More than 1,000 companies from nearly 100 countries produce small arms and light weapons. [Source: Small Arms Survey]
Military expenditure
• Total global military expenditure has risen from US$1.14 trillion in 2001 to $US1.711 trillion in 2014, a rise of 50%. [Source: SIPRI – figures in constant 2011 prices/exchange rates]
• Military expenditure in the Middle East has grown from $US99 to $US173 billion during the same period, a rise of 75% [Source: SIPRI– figures in constant 2011 prices/exchange rates]
The top 10 importers and exporters of major arms, 2010–14 [Source: SIPRI]
Exporter Global share (%)
1. USA 31
2. Russia 27
3. China 5
4. Germany 5
5. France 5
6. UK 4
7. Spain 3
8. Italy 3
9. Ukraine 3
10. Israel 2
Importer Global share (%)
1. India 15
2. Saudi Arabia 5
3. China 5
4. UAE 4
5. Pakistan 4
6. Australia 4
7. Turkey 3
8. USA 3
9. South Korea 3
10. Singapore 3
[Source: SIPRI]
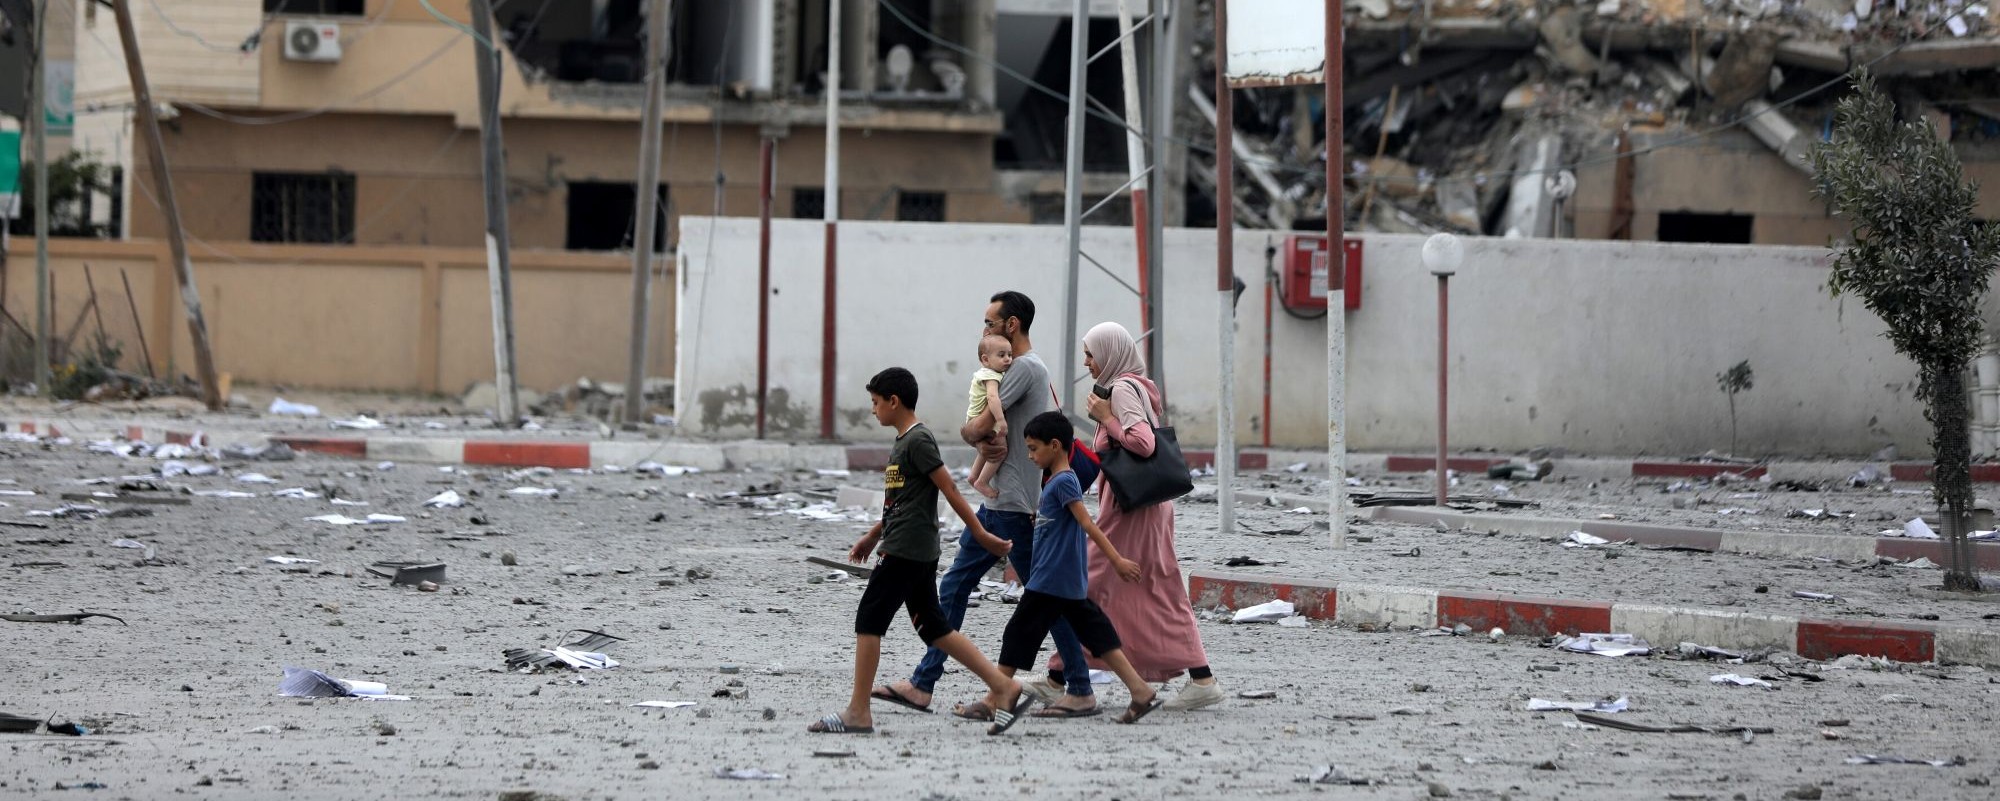
Armed violence
Globally, armed violence kills around 508,000 people every year, most in non-conflict settings.
High homicide rates have been estimated to cost the global economy just under US$2 trillion between 2000 and 2010 – 2.64% of the global output in 2010.